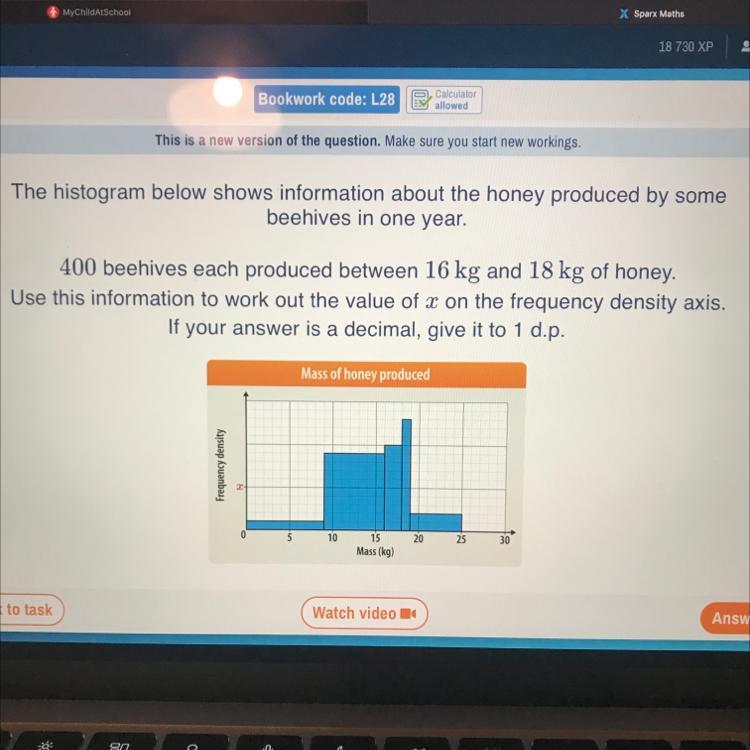
The histogram below shows information about the honey produced by some beehives in one year. 400 beehives each produced between 16 kg and 18 kg of honey. Use this information to work out the value of x on the frequency density axis. If your answer is a decimal, give it to 1 d.p
I give as much as 70
Приложения:
Ответы
Ответ дал:
0
To find the value of x on the frequency density axis, we need to use the formula:
Frequency density = Frequency / Class width
In this case, we know that 400 beehives produced honey between 16 kg and 18 kg. This means the class width is:
Class width = 18 - 16 = 2
We also know that the frequency density is equal to 70. So we can rearrange the formula to solve for x:
Frequency density = Frequency / Class width
70 = Frequency / 2
Frequency = 70 x 2
Frequency = 140
This means that 140 beehives produced honey with a frequency between 16 kg and 18 kg. Therefore, the value of x on the frequency density axis is:
x = Frequency / Class width
x = 140 / 2
x = 70
So the value of x on the frequency density axis is 70.
nastun1983:
Thank you but I’m sorry the number 70 has nothing to do with the task
Вас заинтересует
2 года назад
2 года назад
3 года назад
3 года назад
9 лет назад